Article Open access23 May 2024

13-15 October 2026 | The Royal Institution, London

Abstract
Background
With the advent of genomic technologies, pharmacogenomics has evolved significantly. Such advancement facilitates comprehensive identification of common and rare alleles crucial for psychiatry treatments, especially in context of Indian psychiatric patients who are genetically diverse and for whom data is limited.
MethodsThis study explores the pharmacogenomic spectrum of CYP2C19, CYP2D6, and CYP2C9 genes in an Indian psychiatric cohort of 383 individuals (264 patients, 119 controls) using Axiom PMD Array.
ResultsBeyond common phenotypes like CYP2C19 *1/*2, we identified rare functional phenotypes including CYP2C19 *1/*34, CYP2C9 *1/*11 and CYP2D6 *4/*5 that are frequently overlooked in regular screenings. Interestingly, 3% of individuals were identified as most likely non-responders to medications metabolized by these three enzymes, suggesting the importance of platforms that cover both common and rare alleles in populations with high diversity. The study observed 13.26% poor CYP2C19 metabolizers, 2.27% poor CYP2D6 metabolizers, and 3.41% poor CYP2C9 metabolizers in the psychiatric cohort.
ConclusionsThe study identifies three percent of the cohort shows compromised metabolism across all three genes, emphasizing that comprehensive screening of common along with rare functional variants is essential for personalized psychiatric treatment in India.
Plain Language SummaryPsychiatric medications work differently across various ethnic groups due to differences in gene pool. India has many genetically diverse ethnicities, but we lack data on the genes that affect how psychiatric drugs work in Indian populations. This study examined three important genes (CYP2C19, CYP2D6 and CYP2C9) that regulates how the body processes psychiatric medications. In this study we examined 264 psychiatric patients and 119 healthy individuals using an advanced genetic testing platform that can detect both common and rare genetic variations.We observed that 3% of individuals were identified as most likely non-responders to medications processed by these three studied genes, suggesting standard treatments may not work well for them. Our findings show that testing for only the most frequently reported genetic variants may miss important information in genetically diverse Indian populations. This study suggests that comprehensive genetic testing examining a wide range of genetic variations rather than just common ones can help clinicians to select the most appropriate medications and doses for each patient, ultimately improving treatment outcomes.
Article Open access23 May 2024
Article Open access18 January 2026
Article Open access20 July 2024
A group of isozymes, known as Cytochrome P450, is involved in drug metabolism for most clinically prescribed drugs1. The members of this family have diverse genetic polymorphisms, which are of great clinical significance. These are involved in the metabolism of caffeine, coumarin, warfarin, clopidogrel and many others. Out of this family, CYP2D6, CYP2C19, and CYP2C9 are mostly studied.
There is variability in drug response with respect to effectiveness, optimal dosage, and adverse drugs reactions2. Genetic factors contribute 20–30% to this variation in response to drugs3. Based on the combination of CYP450 star alleles, individuals are categorized into poor, intermediate, normal and ultra-rapid metabolizers. There is continuous research going about the pharmacogenomics, with the help of advanced DNA sequencing technologies and investigation among different ethnic population groups, there are recognized barriers which need to be overcome for better clinical implementation. FDA and CPIC guidelines are well established to guide personalized drug dosing and to prevent adverse drug reactions based on different genes, but their routine use in clinical settings is limited.
Among different pharmacogenes, Cytochrome P450 2D6 (CYP2D6) is involved in the metabolism of several drugs belonging to different disciplines such as psychiatry, pain management, cardiology, and oncology. This enzyme is expressed in liver, brain, intestinal tissue and lymphoid cells4,5 and metabolizes various substrates such as antidepressants, analgesics, antihypertensives and many other drugs6,7,8,9. It is highly polymorphic in nature due to changes such as insertions/deletions/gene duplications/copy number variants and tandem rearrangements10. The frequency of CYP2D6 gene duplication is higher in Asians at 45%11.
CYP2C9, another CYP2C isoform, is abundantly expressed in liver12,13. It metabolizes several clinically used drugs such as anti-coagulants, nonsteroidal anti-inflammatories, anti-diabetics, anti-hypertensives, and anti-epileptics. The alleles that have decreased function or no function can lead to increased exposure of the substrates since they are not metabolized and increase the adverse effects, such as bleeding, neurotoxicity, cardiovascular effects and others14,15. Therefore, according to age, gender, and genotypes, the individuals need the right amount of dosage for successful treatment of the disease. CYP2C9 was included in this study as it metabolizes several mood stabilizers, including phenytoin and valproic acid, which are commonly used in bipolar disorder treatment16,17.
The individuals are classified into phenotype categories: poor, intermediate, and normal metabolizers according to CPIC guidelines18. There are 71 alleles for the CYP2C9 enzyme. The *2 variant (rs1799853) and *3 (rs4986893) have reduced enzymatic activity, and the *1 variant has normal function. The *2 and *3 variants replace the amino acids of protein R14 4 C and 135 L, respectively19. These two variations are highly heterogeneous among different population groups, 8-19% and 3.3-16.6% in Caucasians, 2.9% and 2% in African-Americans, 4.3 and 2.3% in Black/African, and <1% and 3.6% in Asians20.
The CYP2C19 gene plays a crucial role in the metabolism of drugs like antidepressants, antipsychotics, and mood stabilizers. Different variants of the CYP2C19 gene, such as *2, *3, and *17 variations, can greatly impact how well an individual metabolizes these drugs21. Individuals with the *2 or *3 variations are labeled as metabolizers, leading to drug levels in their system and an increased chance of experiencing side effects. On the other hand, those with the *17 variation are known as rapid metabolizers, resulting in lower drug levels that may affect the effectiveness of the medication22. Studies have shown the significance of genotyping CYP2C19 in patients22,23,24. Integrating CYP2C19 genotyping into treatment plans led to outcomes for patients and reduced healthcare expenses. These studies highlight how important it is to use testing to enhance psychotropic drug therapy results.
This kind of baseline data for multiple PGx genes and their multiple alleles is altogether absent in the Indian population, preventing personalized medicine approaches not only for India but also for Indians settled across the globe25. Given the global presence of the Indian diaspora, establishing baseline pharmacogenomic profiles has implications extending far beyond national borders.
The objective of this study is to evaluate the distribution of CYP2C9, CYP2C19, and CYP2D6 alleles that are associated with psychiatric medication metabolism, focusing on identifying rare and population-specific variants. By capturing both common and rare functional alleles, we aim to reconstruct a comprehensive pharmacogenomic reference for the studied genetically diverse and clinically underrepresented cohort.
MethodologySubjectThe current investigation was carried out on a sample of 264 distinct psychiatric patients diagnosed according to the International Classification of Diseases, tenth edition (ICD-10) criteria (Table 1) and 119 healthy controls with no personal or family history of psychiatric disorders. Cases were classified into multiple diagnostic categories, including schizophrenia, bipolar affective disorder, substance dependence, recurrent depressive disorder, obsessive-compulsive disorder, and other mental and behavioral disorders. The participants were recruited from the Department of Psychiatry at a tertiary care hospital in Kanpur, Uttar Pradesh, India. The study population demonstrated diverse geographic origins across different regions of India, providing a broad representation of the Indian genetic landscape. Controls were age and ethnicity-matched healthy individuals (mean age: cases 44.14 ± 0.05 years; controls 42.69 ± 0.10 years) recruited from the same geographic region. This study received ethical approval from the Institutional Ethics Committee of 7 Air Force Hospital, Kanpur, in March 2019, with reference number 15965/58th/9/2020/DGAFMS/DG-3B. Written informed consent was obtained from both patients and healthy controls prior to enrollment in the study.
Table 1 Clinical characteristics of the subjects recruited in the present study DNA isolation and genotypingAfter obtaining informed consent, blood samples of 3 mL were obtained from people and stored at a temperature of 4 °C. Data on anthropometric and socio-demographic characteristics were gathered. The DNA was extracted using the QIAGEN DNA MINI Kit in accordance with the manufacturer’s guidelines. The DNA’s quality and quantity were assessed using a 1% Agarose gel and a Qubit 4 fluorometer.
About 150ng of total genomic DNA is hybridized on the Axiom Precision Medicine Diversity Array (PMDA) using the Axiom 2.0 Plus assay kit as per the manufacturer's instructions. The PMDA is hybridized, washed and scanned on the ThermoFisher GeneTitan Multichannel Microarray system, and raw data in the form of .cel format is utilized for further analysis. The QC settings used were adjusted from the previous study26.
Metabolism status of varied genotypesThe study focused on three pharmacogenes, namely CYP2D6, CYP2C9, and CYP2C19, which play a significant role in the metabolism of psychiatric medicines. The genotypes (*1, *11, *12, *2, *26, *3, *16, *30, *48, *49) of CYP2C9 were categorized into 4 metabolism statuses: Normal, Intermediate, Poor, and Indeterminate.
The genotypes (*1, *2, *3, *34, *35, *17) of the CYP2C19 gene were categorized into several combinations, each representing a specific metabolism status: normal, intermediate, ultrarapid, rapid, poor, and indeterminate. The classification of diverse metabolism - Normal, Intermediate, Ultrarapid, Poor, and Indeterminate—was determined using a combination of varied genotypes for CYP2D6 (*2, *10, *2, *33, *35, *9, *1, *4, *5, *6, *7 *84, *86) along with the copy number.
CYP2D6 copy number variations were determined using the Axiom PMD Array’s built-in copy number detection algorithms. Gene conversions and structural variants, including *36 alleles, were analyzed using the array’s probe coverage. Quality control metrics included dish quality control (DQC ≥ 0.82) and sample call rates (>97%).
The assessment of the metabolic status for the studied genes was conducted in accordance with the guidelines provided by Hicks et al.7 and Johnson et al.27 and both these studies were conducted in accordance with CPIC guidelines (https://cpicpgx.org/guidelines/) indexed in PharmGKB (https://www.pharmgkb.org/).
Statistical analysisAfter genotyping, genotype calling and QC metrics were performed with SNP Axiom Analysis Suite v5.1 (Affymetrix) using diploid threshold configurations and default DishQC settings (DQC ≥ 0.82 and call rate > 0.97). The genotype of all 383 samples is exported in vcf format using Axiom Analysis Suite v5.1. An allele translation plug-in was used to obtain the metabolism of the studied genes. The obtained star allele inference was re-validated using the PharmGKB database and pharmacogenomic annotation tool PAnno28. The number and occurrence of various genotypes are categorized based on distinct metabolism statuses and various psychiatric categories. Population metabolizer frequencies of different ancestries (Africans, Admixed Latin Americans, South Asian, East Asian, European, Middle East Jewish, Oceania were adopted from Koopmans et al.29 for CYP2D6 and CYP2C19 and Zhou et al. for CYP2C930. The data obtained was compared with the present study data, which is further bifurcated into two groups, i.e., the Indian Psychiatric Cohort and the control group. Principal component analysis (PCA) and clustering techniques were adopted to reduce the dimensionality of the data. K-means clustering was applied to the PC scores to group populations based on similarity. The PC scores and cluster assignments were visualized using an interactive Plotly tool. This approach facilitated the identification of population structure and genetic differentiation patterns within the dataset (Figs. 3–5), and the data are summarized in Supplementary Data 4–6. Additionally, the interactive analysis of different phenotype combinations of CYP2D6, CYP2C19, and CYP2C9 was performed to identify the drug-specific phenotypes in the studied population cohort.
Principal component analysisThe allele combination frequencies for global ancestries were obtained from Koopmans et al. for CYP2D6 and CYP2C19, and Zhou et al.30 for CYP2C9, and compared with the present study’s Indian Psychiatric Cohort and Control Group. Principal component analysis was conducted using an in-house developed Python script employing scikit-learn libraries31. Metabolizer frequencies (poor, intermediate, normal, and ultra-rapid metabolizers) were standardized and reduced to two principal components (PC1 and PC2) for visualization. K-means clustering (k = 3) was applied to group populations based on pharmacogenomic profile similarity. Interactive plots were generated to visualize population clustering patterns.
Results and discussionThe genotype frequencies of CYP2D6, CYP2C9, and CYP2C19 in cases and controls are represented in the Supplementary Data 7. In addition, the frequencies of CYP2C9, CYP2C19, and CYP2D6 genotypes in various other psychiatric traits have been provided in the Supplementary Data 1–3, respectively.
CYP2C19Intermediate metabolismThe overall genotype frequency in cases and controls for the intermediate metabolizer is 44.32% and 60.50%, respectively. It is important to understand that the genotype *1/*2 was found in the majority of cases and controls with a frequency of 28.79% and 49.58% respectively, followed by *2/*17 having 12.12% in cases and 10.92 in controls. While the genotypes *1/*3, *1/*34, *1/*35 had the frequency of 0.76, 1.89, 0.76 in cases, respectively. As it has been a common practice in pharmacogenomics to screen for the common allelic combinations (*1/*2, *2/*17). But this could be correct for European and Caucasian populations where the population admixture is very less. While this may not represent the correct depiction of a pharmacogenomics of the individual of Indian origin, as the Indian population is highly admixed, and the individual might confer the allelic combination that was not screened during the examination. Therefore, it is pertinent to investigate the individuals for genotypes including *1/*3, *1/*34, and *1/*35.
Poor metabolismThe genotype frequency of the poor metabolism genotype (*2/*2) is 13.26% in cases and 12.61% in controls.
Rapid metabolismThe genotype frequency of the rapid metabolizer (*1/*17) was observed to be 18.18% in cases and 8.4% in controls.
Ultrarapid metabolismThe genotype frequency of the ultrarapid metabolizer (*17/*17) was 1.89% in overall cases and 1.68% in overall controls.
CYP2C9Intermediate metabolismThe frequencies of CYP2C9 genotypes for intermediate metabolizer are: *1/*11, *1/*12, and *1/*26. In cases, the frequency was 0.38%; in cases and controls, it was 8.71% and 4.20%, respectively. The frequency of *1/*3 in cases and controls was 18.56% and 17.65% respectively. It is important to note that the genotypes with very low frequency, *1/*11, *1/*12, and *1/*26, are of great importance as they might be the actual role players in some individuals for showing the intermediate metabolizer. Hence, focusing solely on highly prevalent alleles fails to capture the true variability in pharmacogenomic profiles and may overlook clinically relevant rare variants.
Poor metabolismThe genotypes related to the poor metabolism status, including *2/*3 in cases and controls, were observed to be 1.52% and 1.68% in cases and controls, respectively. While the genotype *3/*16 was found with a genotype frequency of 0.38 % in cases. The *3/*3 has the frequency of 1.52% and 1.68% in controls. The *3/*30 genotype was observed to have a frequency of 0.84% in controls.
CYP2D6Intermediate metabolismThe overall genotype frequency of the intermediate metabolizer in cases was found to be 29.55% in cases and 26.05% in controls. But it is pertinent to consider the genotypes with very low frequency in the Indian context, considering the admixture in the Indian population.
Poor metabolismThe overall frequency of the poor metabolic genotypes (*4/*4 and *4/*5) was found to be 2.27 in cases. While *4/*4 has the frequency of 1.89% in cases, and *4/*5 has 0.38% in cases.
Ultrarapid metabolismThe individuals with genotypes (*1/*2)×N, *1/*1×N, *2/*2×N fall under the ultrarapid metabolizer with an overall frequency of 1.52% in cases and 3.36% in controls. While (*1/*2)×N was observed to have the highest frequency in cases compared to the *2/*2×N. The graphical representation of different types of the metabolizers for all the three genes has been provided in Figs. 1 and 2. Expected genotype combinations such as CYP2C19 *3/*17 (intermediate metabolizers) and *2/*3, *3/*3 combinations (poor metabolizers) were not observed in this cohort. This absence aligns with established literature showing extremely low frequencies of *2/*3 and *3/*3 genotype combinations in Indian populations32, indicating population-specific genetic architecture rather than methodological limitations.
Fig. 1: Metabolizer phenotype distribution of CYP2D6, CYP2C9, and CYP2C19 in the studied psychiatric cases.
Chord chart displaying the distribution of metabolizer phenotypes for three cytochrome P450 enzymes (CYP2D6, CYP2C9, and CYP2C19) in the studied psychiatric patient cohort (N = 264). The chart is divided into three main segments representing each studied CYP enzyme. Blue segments represent CYP2C19 phenotypes, orange segments represent CYP2C9 phenotypes, and green segments represent CYP2D6 phenotypes. The width of each segment corresponds to the percentage of individuals within each metabolizer category.
Fig. 2: Metabolizer phenotype distribution of CYP2D6, CYP2C9, and CYP2C19 in the studied controls.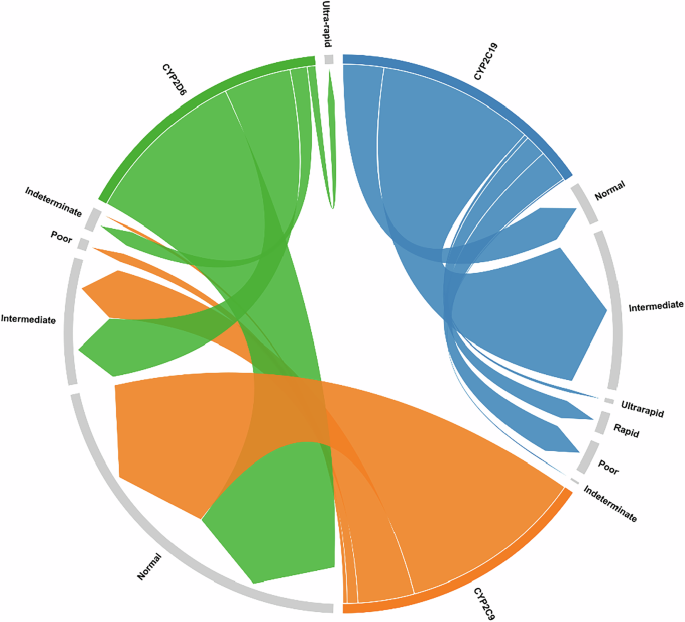
Chord Chart displaying the distribution of metabolizer phenotypes for three cytochrome P450 enzymes (CYP2D6, CYP2C9 and CYP2C19) in the studied control group. Blue segments represent CYP2C19 phenotypes, orange segments represent CYP2C9 phenotypes, and green segments represent CYP2D6 phenotypes. The width of each segment corresponds to the percentage of individuals within each metabolizer category.
Moreover, the PCA analysis for CYP2C9 (Fig. 3) has shown a distinct clustering pattern of the Indian psychiatric cohort, which might indicate that the Indian psychiatric population has different pharmacogenomic characteristics impacting drug metabolism than other populations around the world. Its closeness to the Middle East cluster suggests that there may be a common ancestry that influences how an individual responds to drugs. Additional research on pharmacogenetic differences in the Indian population is warranted due to the control group’s intermediate position between large population clusters. Similarly, for CYP2C19 (Fig. 4), it appears that it might be regulating the drug metabolism based on the similarity between the studied control group and the psychiatric cohort, as indicated by the overlap between the two clusters. Nevertheless, the dispersion from large global populations such as those in Europe and East Asia brings to light the possibility of population-specific pharmacogenomic variations that may influence treatment results and approaches to drug discovery. While the shared pharmacogenomic landscapes among the Indian population are additionally strengthened by the CYP2D6 plot (Fig. 5), which further underlines the overlap between the Indian psychiatric cohort and control group. The unique distribution of large populations around the world highlights the need for precision medicine strategies targeting mental diseases to account for population-specific pharmacogenomic differences.
Fig. 3: PCA plot representing the genotype frequency distribution of CYP2C9 among different population cohorts of the world compared to the studied Indian Psychiatric cohort and control group.
PCA scatter plot showing the genetic distance and relationships between different global populations based on CYP2C9 genotype frequencies. Each point represents a distinct population group, positioned according to their similarity in CYP2C9 genetic variants. The x-axis represents PC 1, and the y-axis represents PC 2. Different colors and symbols indicate different population groups: blue circles (African populations), light blue diamond (Admixed Latin Americans), red diamonds (South Asians), light pink circle (East Asians), green diamond (Europeans), light green diamond (Middle East population), orange diamond (Oceania population), yellow squares (studied Indian Psychiatric Cohort) and purple squares (Control Group). The clustering of populations indicates genetic similarity, while the distance between populations reflects genetic divergence in CYP2C9 allele frequencies.
Fig. 4: PCA plot representing the genotype frequency distribution of CYP2C19 among different population cohorts of the world compared to the Indian Psychiatric cohort and control group.
PCA scatter plot showing the genetic distance and relationships between different global populations based on CYP2C19 genotype frequencies. Each point represents a distinct population group, positioned according to their similarity in CYP2C19 genetic variants. The x-axis represents PC 1, and the y-axis represents PC 2. Different colors and symbols indicate different population groups: blue circle (African populations), light blue diamond (Admixed Latin Americans), red square (South Asians), light pink square (East Asians), green circle (Europeans), light green diamond (Middle East population), orange circle (Oceania population), yellow squares (studied Indian Psychiatric Cohort) and purple squares (studied control Group). The clustering of populations indicates genetic similarity, while the distance between populations reflects genetic divergence in CYP2C19 allele frequencies.
Fig. 5: PCA plot representing the genotype frequency distribution of CYP2D6 among different population cohorts of the world compared to the Indian Psychiatric cohort and control group.
PCA scatter plot showing the genetic distance and relationships between different global populations based on CYP2D6 genotype frequencies. Each point represents a distinct population group, positioned according to their similarity in CYP2D6 genetic variants. The x-axis represents PC 1, and the y-axis represents PC 2. Different colors and symbols indicate different population groups: blue circle (African population), light blue diamond (Admixed Latin Americans), red diamond (South Asians), light pink circle (East Asians), green square (Europeans), light green circle (Middle East Jewish), orange diamond (Oceania population), yellow diamond (studied Indian Psychiatric Cohort) and purple diamond (studied control Group). The clustering of populations indicates genetic similarity, while the distance between populations reflects genetic divergence in CYP2D6 allele frequencies.
Furthermore, the interactive analysis of different drug metabolism status of CYP2D6, CYP2C19, and CYP2C9 has shown interesting findings (Table 2). The models were given the preference score based on the drug metabolism statuses. It was observed that the Model 1 was having the top preference score as 12 individuals who were IM for CYP2C9, are the ones who are IM/PM for CYP2D6 and CYP2C19, corresponding to 3% of the overall studied cohort (2% in cases and 5% in controls) (Table 2). This suggests that these individuals are likely non-responders to any of the psychiatric drugs, requiring alternative therapeutic strategies. Similarly, for model 5, 6, and 7 the ID metabolizer is needed to be fine mapped for their respective genes to identify their potential status. For Models 2–4, the subjects in the UR, RM, and NM are needed to prescribe their specific drugs corresponding to their drug-metabolizing genes. These findings highlight the importance of pharmacogenomics in the personalized treatment of psychiatric traits and the need for reconstruction of the pharmacogenomic landscape of psychiatric traits in the Indian population.
Table 2 Interactive analysis of various metabolizers of the CYP2D6, CYP2C19, and CYP2C9 in the studied population DiscussionThe Indian subcontinent has been characterized by numerous migrations, admixtures, and social stratifications, which have also resulted in the genetic diversity of India. The genetic background of a person is often complex; this means that any allele interacts with multiple other alleles, and the different populations have large differences in the frequencies of the many alleles, and these differences are detailed among populations. Thus, focusing on the allelic combinations commonly reported might fail to present a complete scenario in highly admixed Indians, suggesting the use of a genome-wide approach to decipher this void33.
The present study highlights the importance of considering the low-frequency genotypes in pharmacogenomic screening, particularly for genes involved in drug metabolism, such as CYP2D6, CYP2C9, and CYP2C19. These genes exhibit substantial variability in their allelic distributions across different ethnic groups, and the Indian population harbors unique genotype combinations that may not be prevalent in other populations.
It was observed that while the common allelic combinations, such as CYP2C19 *1/*2 and *2/*17, were relatively frequent in the study cohort, as in corroboration with another study where the *2 and *17 were found to be relatively most prevalent24, genotypes with lower frequencies, such as *1/*3, *1/*34, and *1/*35, were also present. The poor metabolizers of CYP2C19 were found to be high with a frequency of 13.26% in the present study, which is similar to a study where the frequency was found to be 12.6% in the South Indian Population34.
For CYP2C9, the genotypes like *1/*11, *1/*12, and *1/*26, although rare, were detected in the Indian population. While *1/*2 and *1/*3 were found to be higher in the studied population group. A previous study conducted in the Indian population reported similar results with a higher frequency of CYP2C9*2 and CYP2C9*323.
Similarly, the intermediate metabolizer of CYP2D6 in cases was found to be 29.55% and 26.05 % in controls, while a low frequency of (*4/*4 and *4/*5) poor metabolizers was observed in the present study. The findings of the present study are in corroboration with a study, where the prevalence of poor metabolizer was observed to be lower in the Indian population35. Another similar finding observed lower prevalence (0.6%) of *4/*4 and *4/*5 genotypes in the South Indian population; moreover, the study also confirms the genetic architecture of the CYP2D6 is different from East Asian, Caucasian, and African populations36. Moreover, a study reported that one in three Indian will benefit by altering the doses of psychiatric drugs based on the CYP2D6 phenotyping37. These findings underscore the importance of comprehensive genotyping approaches that capture the full spectrum of genetic variations, including low-frequency alleles and genotype combinations.
Not considering low-frequency genotypes in pharmacogenomic screening could inaccurately predict drug metabolism and response, potentially leading to treatment failures or increased risk for adverse drug reactions. By taking into account the total genetic diversity in Indian populations, drug therapies and doses will be more precisely suited for each individual, leading to maximum benefits of drug treatment and reducing the risk of side effects.
More importantly, the study outlines the development of population-specific pharmacogenomic guidelines and reference databases. Though International guidelines like the ones from the Clinical Pharmacogenetics Implementation Consortium (CPIC) (https://cpicpgx.org/) and Pharmacogenomics Knowledgebase (PharmGKB) (https://www.pharmgkb.org/) serve as good references, they also do not cover the wide spectrum of genetic variants encountered in the Indian population. Developing Indian-specific databases and guidelines that incorporate the unique genetic variations observed in this population would be a significant step towards personalized medicine in India.
The present study dataset represents an initial exploration of pharmacogenomic diversity in Indian psychiatric populations. Despite this modest sample size, we identified rare allelic combinations in all studied genes at frequencies ranging from 0.38% to 1.89%, indicating these variants may be more prevalent in Indians than in global databases.
The present study approach focused on genotype-to-phenotype predictions rather than clinical outcomes in order to establish a multi-gene combinatory foundational dataset before implementing prospective pharmacogenomic-guided treatment studies38,39.
The identification of poor metabolizers in 3% of individuals demonstrates their clinical relevance. These findings deliver foundational data establishing the existence and relevance of population-specific phenotypes. It is anticipated that there will be more studies in the future with larger and diverse cohorts in order to have precise frequency estimates to facilitate the development of India-specific pharmacogenomic guidelines.
The importance of considering low-frequency genotypes in pharmacogenomic screening cannot be overstated, especially for genetically diverse and admixed populations like the Indian population. Embracing the full spectrum of genetic variations will enable healthcare providers to comprehend and foresee individual drug responses with greater precision, ultimately enabling them to come up with more personalized and effective treatment strategies. In addition, it is worth noting that this approach is consistent with precision medicine ideas.
Data availabilityIndividual participant metadata are not publicly available because participants did not consent to data sharing beyond the scope of this study, and the data contain personal information protected under the Indian Council of Medical Research (ICMR) ethical guidelines and the institutional ethics policies of 7 Air Force Hospital, Kanpur. Source data not subject to these restrictions are provided with this paper. Source data for Figs. 1 and 2 are provided in Supplementary Data 1–3. Source data for Fig. 3 are provided in Supplementary Data 6. Source data for Fig. 4 are provided in Supplementary Data 5. Source data for Fig. 5 are provided in Supplementary Data 4. De-identified raw genotyping data have been deposited in Figshare40.
Code availabilityThe code used in the manuscript is present in the public repository https://doi.org/10.5281/zenodo.1824273431.
ReferencesFurge, L. L. & Guengerich, F. P. Cytochrome P450 enzymes in drug metabolism and chemical toxicology: an introduction. Biochem. Mol. Biol. Educ. 34, 66–74 (2006).
Weinshilboum, R. M. & Wang, L. Pharmacogenetics and pharmacogenomics: development, science, and translation. Annu. Rev. Genomics Hum. Genet. 7, 223–245 (2006).
Sim, S. C., Kacevska, M. & Ingelman-Sundberg, M. Pharmacogenomics of drug-metabolizing enzymes: a recent update on clinical implications and endogenous effects. Pharmacogenomics J. 13, 1–11 (2013).
Dutheil, F. et al. Xenobiotic-metabolizing enzymes and transporters in the normal human brain: regional and cellular mapping as a basis for putative roles in cerebral function. Drug Metab. Dispos. 37, 1528–1538 (2009).
Gopisankar, M. G. CYP2D6 pharmacogenomics. Egypt. J. Med. Hum. Genet. 18, 309–313 (2017).
Gaedigk, A. Complexities of CYP2D6 gene analysis and interpretation. Int. Rev. Psychiatry 25, 534–553 (2013).
Hicks, J. K. et al. Clinical Pharmacogenetics Implementation Consortium (CPIC) Guideline for CYP2D6 and CYP2C19 genotypes and dosing of selective serotonin reuptake inhibitors. Clin. Pharm. Ther. 98, 127–134 (2015).
Beoris, M. et al. CYP2D6 copy number distribution in the US population. Pharmacogenet. Genomics 26, 96–99 (2016).
Fleeman, N. et al. Cytochrome P450 testing for prescribing antipsychotics in adults with schizophrenia: systematic review and meta-analyses. Pharmacogenomics J. 11, 1–14 (2011).
Chan, W. et al. CYP2D6 allele frequencies, copy number variants, and tandems in the population of Hong Kong. J. Clin. Lab. Anal. 33, e22634 (2019).
Sistonen, J. et al. CYP2D6 genotyping by a multiplex primer extension reaction. Clin. Chem. 51, 1291–1295 (2005).
Miners, J. O. & Birkett, D. J. Cytochrome P4502C9: an enzyme of major importance in human drug metabolism. Br. J. Clin. Pharm. 45, 525–538 (1998).
Daly, A. K., Rettie, A. E., Fowler, D. M. & Miners, J. O. Pharmacogenomics of CYP2C9: functional and clinical considerations. J. Pers. Med. 8, 1 (2017).
Macias, Y. et al. An update on the pharmacogenomics of NSAID metabolism and the risk of gastrointestinal bleeding. Expert Opin. Drug Metab. Toxicol. 16, 319–332 (2020).
Selmaj, K. et al. Siponimod for patients with relapsing-remitting multiple sclerosis (BOLD): an adaptive, dose-ranging, randomised, phase 2 study. Lancet Neurol. 12, 756–767 (2013).
Franco, V. & Perucca, E. CYP2C9 polymorphisms and phenytoin metabolism: implications for adverse effects. Expert Opin. Drug Metab. Toxicol. 11, 1269–1279 (2015).
Ho, P. C. et al. Influence of CYP2C9 genotypes on the formation of a hepatotoxic metabolite of valproic acid in human liver microsomes. Pharmacogenomics J. 3, 335–342 (2003).
Caudle, K. E. et al. Standardizing terms for clinical pharmacogenetic test results: consensus terms from the Clinical Pharmacogenetics Implementation Consortium (CPIC). Genet Med 19, 215–223 (2017).
Umamaheswaran, G., Kumar, D. K. & Adithan, C. Distribution of genetic polymorphisms of genes encoding drug metabolizing enzymes & drug transporters—a review with Indian perspective. Indian J. Med. Res. 139, 27–65 (2014).
Yasuda, S. U., Zhang, L. & Huang, S. M. The role of ethnicity in variability in response to drugs: focus on clinical pharmacology studies. Clin. Pharm. Ther. 84, 417–423 (2008).
Hicks, J. K. et al. Clinical pharmacogenetics implementation consortium guideline (CPIC) for CYP2D6 and CYP2C19 genotypes and dosing of tricyclic antidepressants: 2016 update. Clin. Pharm. Ther. 102, 37–44 (2017).
Jukić, M. M. et al. Impact of CYP2C19 Genotype on escitalopram exposure and therapeutic failure: a retrospective study based on 2,087 patients. Am. J. Psychiatry 175, 463–470 (2018).
Mehta, M. P. et al. Prevalence of CYP2C9 and CYP2C19 variants and the impact on clopidogrel efficacy in patients having CYPC19*2 variant. Indian J. Pharmacol. 55, 27–33 (2023).
Naushad, S. M. et al. Mechanistic insights into the CYP2C19 genetic variants prevalent in the Indian population. Gene 784, 145592 (2021).
Duconge, J. & Ruano, G. Admixture and ethno-specific alleles: missing links for global pharmacogenomics. Pharmacogenomics 17, 1479–1482 (2016).
Garg, R. et al. Pharmaco-genetic analysis of CYP1A1 and RGS4 variants and its impact on response to olanzapine and risperidone in Indian schizophrenic cohort. Am. J. Transl. Res. 15, 4763–4769 (2023).
Johnson, J. A. et al. Clinical Pharmacogenetics Implementation Consortium (CPIC) Guideline for Pharmacogenetics-Guided Warfarin Dosing: 2017 Update. Clin. Pharm. Ther. 102, 397–404 (2017).
Liu, Y. et al. PAnno: a pharmacogenomics annotation tool for clinical genomic testing. Front Pharm. 14, 1008330 (2023).
Koopmans, A. B. CYP2D6 and CYP2C19 Genotyping in Psychiatry: Bridging the Gap between Practice and Lab (Maastricht University, Netherlands, 2021) p 207.
Zhou, Y. et al. Global distribution of functionally important CYP2C9 alleles and their inferred metabolic consequences. Hum. Genomics 17, 15 (2023).
Sharma, V. sharmavarun840/Kmean_PCA (V1.1). Zenodo (2025).
Bhat, K. G. et al. Pharmacogenomic evaluation of CYP2C19 alleles linking low clopidogrel response and the risk of acute coronary syndrome in Indians. J. Gene Med. 26, e3634 (2024).
Fernandez-Rhodes, L. Beyond borders: a commentary on the benefit of promoting immigrant populations in genome-wide association studies. HGG Adv. 4, 100205 (2023).
Jose, R. et al. CYP2C9 and CYP2C19 genetic polymorphisms: frequencies in the south Indian population. Fundam. Clin. Pharm. 19, 101–105 (2005).
Dhuya, M. et al. Cytochrome P(450) 2D6 polymorphism in the eastern Indian population. Indian J. Pharm. 52, 189–195 (2020).
Naveen, A. T. et al. CYP2D6 genetic polymorphism in South Indian populations. Biol. Pharm. Bull. 29, 1655–1658 (2006).
Sivadas, A. et al. The genomic landscape of CYP2D6 variation in the Indian population. Pharmacogenomics 25, 147–160 (2024).
Villagra, D. et al. Novel drug metabolism indices for pharmacogenetic functional status based on combinatory genotyping of CYP2C9, CYP2C19 and CYP2D6 genes. Biomark. Med. 5, 427–438 (2011).
Melis, R., Lyon, E. & McMillin, G. A. Determination of CYP2D6, CYP2C9 and CYP2C19 genotypes with Tag-It mutation detection assays. Expert Rev. Mol. Diagn. 6, 811–820 (2006).
Sharma, V. Reconstructing the Pharmacogenomic Landscape of Psychiatric Medication Metabolism in the Indian population. figshare https://doi.org/10.6084/m9.figshare.31072582 (2026).
The authors thank the research participants from all sites who made this study possible. All authors acknowledge NMC Genetics India Pvt. Ltd. for providing genotyping services. All authors acknowledge Mr. Adireddi Govind Rao for providing the in-house developed tool, Pensive.one, for re-evaluation of pharmacogenomics annotations. The authors acknowledge Prof. V.K. Tripathi, former Head of School of Languages & Literature, SMVDU, for his assistance with language editing and grammatical review of the manuscript. The authors also acknowledge Dr. Manmohan and Ms. Divya Deepika Bhasin for providing the “Curiosity” platform for clinical and genomic data management. No external funding was received for this study.
Author information
Authors and Affiliations
7 Air Force Hospital, Kanpur, Uttar Pradesh, India
Rajat Garg & Vibha Singh
Department of Psychiatry, Command Hospital, Bangalore, Karnataka, India
SK Saxena & Amit Kumar
Department of Community Medicine, Military Hospital Kanpur, Kanpur, Uttar Pradesh, India
Sabreen Bashir
NMC Genetics India Private Limited, Gurugram, India
Hemender Singh, Nidhi Chahal & Varun Sharma
Keck School of Medicine, University of Southern California, Los Angeles, CA, USA
Indu Sharma
R.G. conducted the diagnosis and clinical examination of the patients and served as PI of the study. S.K.S., V.S., A.K., and S.B. conducted the clinical classification and diagnosis of the subjects recruited in the present study. N.C. generated the genetic data. H.S., I.S., and V.S. performed the analysis. H.S. and I.S. wrote the paper. V.S. and R.G. reviewed the paper.
Corresponding authors Ethics declarationsCompeting interestsNMC Genetics India Private Limited provided genotyping and data analytics services as part of a research collaboration. The commercial interest is disclosed as V.S., N.C., and H.S. are affiliated with NMC Genetics India. This relationship did not influence study design, data analysis, or manuscript preparation. The remaining authors declare no competing interests.
Peer reviewPeer review informationCommunications Medicine thanks the anonymous reviewers for their contribution to the peer review of this work. A peer review file is available.